Boosting Revenue and ROI: Crafting an Effective Marketing Plan to Achieve Growth (Part 1)
Imagine a scenario where we find ourselves midway through the first month of the 2nd half of the year. In most cases, the C-suite is concerned about making their number given the current economic conditions. You might be tempted, due to instinct, to add new programs to the mix or exhaust your existing programs. Yes, plans need to be changed to hit the targets. But maybe the planning process itself needs to be rebuilt too?
Another possible scenario is getting to the end of the year and not hitting your revenue goals. Everyone is trying to do everything possible and looking for bluebirds, but you also need to think about a marketing plan for the next year (the earlier, the better).

In this series, we will walk you through the necessary steps for building an effective and revenue-generating marketing plan. You need to make sure you:
- Reverse engineer your goals. Have a clear understanding of your targets before you hop into executing your tactics.
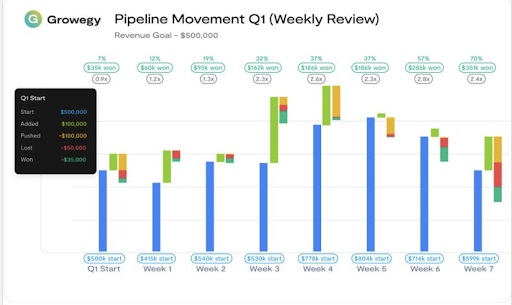
- Take a deep dive into your pipeline and review what is closing next quarters. Additionally, review the historical percentage of the pipeline that has been pushed to future quarters.
- Understand the stages’ velocity.
- Identify the needed pipeline coverage target.
- Align your marketing programs and campaigns with your revenue goals and budget.
- Monitor performance. It’ll help to have transparency on how your programs perform and fix things that don’t work as soon as possible.
Let’s look at each step closely.
To head off this dreaded question marketers must pivot to understanding and speaking more sales-based metrics. Preventing it is wonderful but what happens if you have this problem now?
In this article, we are going to offer a cheat sheet to try and help the marketer with short-term bluebirds. Before we do, we will explore how our clients have tackled the issue. We will start with how to see the need for bluebirds forming, where to find bluebirds, and preventing the need for bluebird revenue.
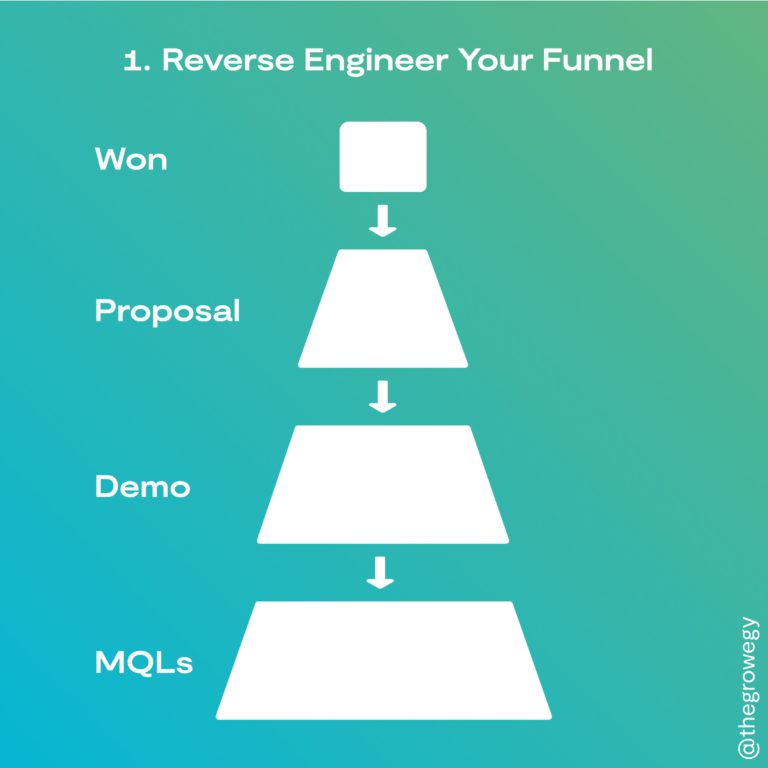
REVERSE ENGINEER YOUR GOALS
Let’s dive into the first step, reverse engineering your goals. What’s the reverse engineering of marketing goals about? In this post we define it as the process of deconstructing and analyzing the desired outcomes or objectives of a marketing team, revenue in our case, and working backward to determine the steps and strategies needed to achieve the desired revenue outcomes.
Here are six things to get you started:
- Begin with your revenue goal and divide by your average selling price to determine how many deals your company needs to win.
- Calculate your conversion rates between each sales and marketing stage. As an example, if your company had 3 stages MQL-Demo-Won and the conversion rate between each stage is 20%. We want to get 20 Won Deals, therefore we need 20*5 = 100 Demo, and number of MQLs is going to be 100*5 = 500.
- Now calculate how long it takes MQLs to become Demos and Demos to become Won Deals.
- With these metrics you can assemble your marketing strategy. Answer questions such as:
- In order to win deals in Q4, when do you need to produce the MQLs?
- Which campaigns, programs, and channels can produce these MQLs?
- Compare the available budget and bandwidth to the needed production. Use these constraints to align the marketing team around a plan of action.
- Review outputs and outcomes weekly to ensure your calculated conversion rates are on track and adjust as needed.
Once you are done with reverse engineering of your marketing goals, you will have a clear understanding of the KPIs that you have to hit on each stage. These metrics will facilitate effective communication across departments, foster transparency, clarify the goals and ensure that everyone is aligned.
REVIEW YOUR PIPELINE
How do you take a deep dive into the sales pipeline coverage? We start with gathering information about each quarter so we can determine which quarters need the most focus.
Starting with the pipeline for this quarter, which we’ll conveniently call “Q1”, run a report that shows all Open Opportunities with a Close Date set for this quarter. Next you want to filter out early stage opportunities that don’t typically close within 90 days. This is unique for each company and you can find your average by running a closed won report with average stage duration shown. As an example, your company has 6 stages, and it takes closed-won deals on average 80 days to get to closed-won then you’ll want to filter out the first three stages.
This will give you a clearer understanding of where the company stands and how close you are to reaching your coverage goals for Q1. For each successive quarter you run the same exercise adjusting which stages are allowed in the coverage calculations based on stage velocity. So for Q2, we may only filter out the first two stages, Q3 we would filter out 1 stage.
This enables the savvy marketer to think ahead! By analyzing your pipeline several quarters in advance, you can examine pipeline coverage gaps while you still have time to address them.
To help keep your pipeline coverage model realistic, calculate the average percentage of your pipeline that has been pushed in the past. Use this percentage in your projections to account for any potential delays or push from previous quarters. Now you have a better idea of pipeline coverage gaps, you are ready to consider marketing channels and tactics.
This is a meticulous approach to planning marketing, but one that enables the rest of the company (particularly finance and sales) to see you are a strategic partner helping them win. Each marketing program takes time to mature (to move through sales stages at your company’s unique conversion rates). By choosing marketing programs today or planning when they launch based on when they mature, you are providing the company with the best chance to succeed.
This isn’t a traditional marketing practice or activity. We challenge marketers to elevate their understanding of all the tools and data available to them today. Traditionally marketers would pick whatever is converting best, has the best top-of-funnel ROI, and would completely miss revenue goals. By taking the time to review your pipeline coverage, marketers can bridge a top-of-funnel perspective with a revenue-minded perspective. Walk this non-traditional path and you’ll be well-equipped to drive success and achieve your revenue targets.
UNDERSTAND STAGE VELOCITY
Understanding the stages’ velocity is a crucial step in planning and executing your marketing tactics effectively. It involves analyzing and tracking the time it takes for leads to move through each stage of your sales pipeline. By understanding the stages’ velocity, you can identify bottlenecks or areas of inefficiency in your pipeline and take appropriate action to improve them.
Here are some steps you can take to optimize the stages velocity:
1️. Define your sales stages: Start by clearly defining the different stages of your sales process, from lead generation to closed deal. This may include stages such as lead qualification, discovery, demo, proposal, negotiation, and close.
2️. Measure the average time spent in each stage: Track the time it takes for leads to move from one stage to the next. This will help you identify areas where leads are getting stuck or taking longer than expected to progress. If you don’t have this data, start tracking it by adding timestamps fields in your CRM.
3️. Identify bottlenecks: Analyze your data to identify any stages where leads are spending an unusually long time or getting stuck. This could indicate a problem with your sales process, such as a lack of follow-up or resources, or a need for additional training or support.
4️. Improve efficiency: Once you’ve identified bottlenecks, brainstorm and implement strategies to improve the speed and efficiency of each stage. This could include streamlining processes, providing additional training or resources, or implementing automation tools to speed up manual tasks.
5️. Test and iterate: As you make changes, track their impact on stages velocity and overall pipeline performance. Continuously test and iterate your strategies to find the most effective ways to move leads through the pipeline quickly and efficiently. You also can find patterns that would work with specific markets, locations, personas that can be used to improve the process.
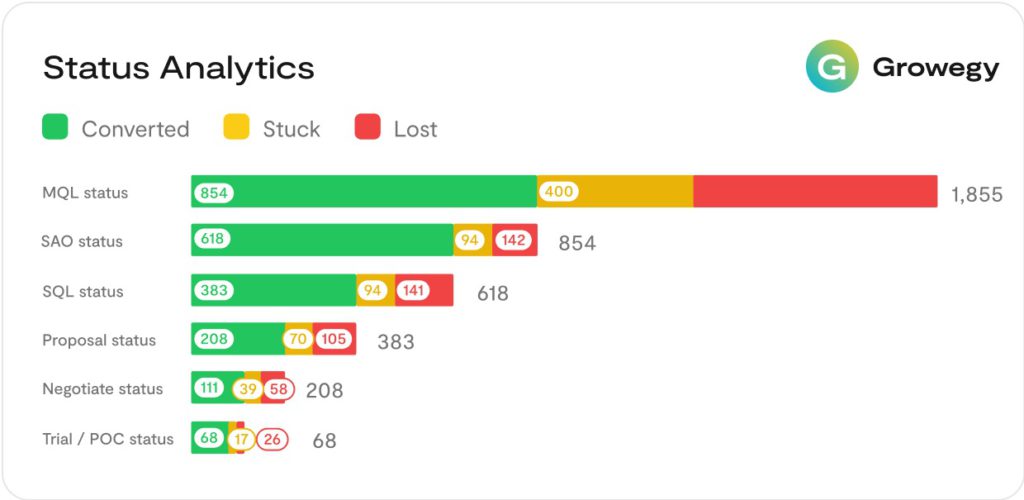
6️. Review different statuses: All the groups are important, so remember to regularly review the Stuck group. “Maybe” is worse than “No” because when you receive a “No,” you can move on and focus your energy elsewhere. However, if you are constantly encountering “Maybe,” you may be getting stuck and wasting your team’s time. Hence, it is crucial to ensure that the BANT (Budget, Authority, Need, Timing) criteria are met before pursuing a potential customer.
Stage Velocity Analytics is a critical component of effective marketing planning and execution. By optimizing the time it takes for leads to move through each stage of your sales process, you can increase conversion rates, shorten sales cycles, improve ROI, and ultimately achieve your revenue goals.
CALCULATE NEEDED PIPELINE COVERAGE
Are you grappling with the elusive quest to pinpoint the perfect pipeline coverage target? Let’s endeavor to uncover the precise pipeline coverage target you need.
What exactly does pipeline coverage mean? It’s a straightforward equation: Total Pipeline Size divided by Total Sales Target Value. Picture this: your quarterly sales goal is set at $1M. To compute the Total Pipeline Size, you need to generate a qualified opportunity report, focusing on close dates for the upcoming quarter. Let’s assume this tally comes to an impressive $3M. In this scenario, you already have a 3X pipeline coverage – the question is, is that enough to guarantee success?
To unravel this conundrum, let’s look at the closed/won rate. Suppose you manage to secure 20 deals out of 80 Qualified Demos; your close rate stands at 25%. Most companies would settle for this & conclude that a 4x pipeline coverage target is sufficient. But, here’s where the plot thickens – we must factor in the Push rate.
The Push rate is the percentage of opportunities that inevitably get pushed to later quarters. It’s a variable that changes from one company to another, but it’s no mystery; there are strategies to monitor & enhance it. Since we can’t rely on bluebirds or sudden shifts in behavior to make our number, let’s refine our calculations. Let’s assume the Push rate is 35%. In our context that means that 35% of our identified opportunities won’t close this quarter.
Let’s take stock of our position:
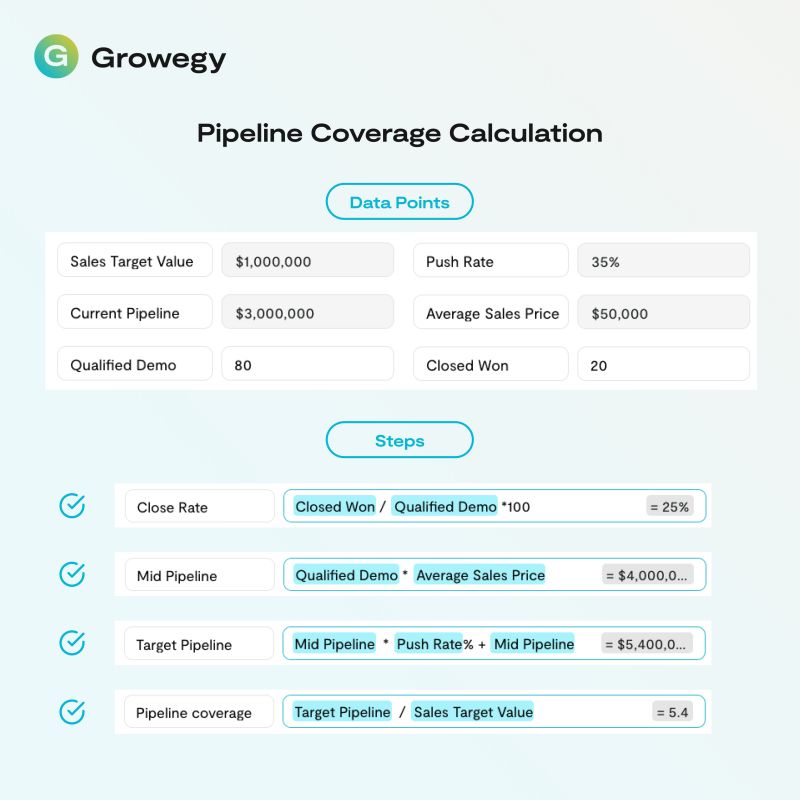
- Our overarching goal is a $1 million.
- The close rate stands at a 25%.
- The push rate hovers at 35%.
- The average sales price (ASP) is a $50,000.
So, what’s the magic number for our needed pipeline coverage?
To achieve to our hefty $1M quarter, we must successfully close 20 deals (simple math: $1M / $50k = 20). Achieving this means we need to have 80 Qualified Demos in the pipeline, all poised to close within the quarter (calculation: 20 * 100% / 25%), translating to a $4M pipeline (let’s call it Mid Pipeline). Now, let’s layer in the 35% pushed rate – the result? We arrive at a more precise figure of $5.4M ($4M*35% + $4M = $5.4M). The true pipeline coverage needed isn’t just 4x; it’s an agile 5.4x. By factoring in the potential Push rate, we paint a more realistic picture of the pipeline coverage required to reach our goals.
It’s crucial to acknowledge that finding the ideal pipeline coverage target isn’t a one-size-fits-all project. Luckily, tools like Growegy are here to lend a helping hand. The tools harness historical & real-time pipeline data to pinpoint a more accurate Pipeline Coverage Ratio, offering your team invaluable insights into the ever-evolving pipeline landscape. Take control of your pipeline coverage strategy for guaranteed wins! Schedule a demo with us and we will help you to find success.
In the next part, we will go over aligning your marketing programs and campaigns with your revenue goals and budget and monitoring performance.
Follow Us
Download
© 2020-2026 Growegy. All rights reserved.
Growegy is not a credit repair organization, financial advisor, financial planner, investment advisor, tax preparer, or acting as a fiduciary, as those or similar terms may be defined under federal or state law. Growegy makes recommendations you may find helpful. Growegy reports business tradelines to business credit bureaus. It is up to you to make the final decision about what is in your and your business’s financial interest.